


Detection of mitophagy with Keima-Red
 Mitophagy is the selective degradation of old or depolarized mitochondria by autophagy and contributes maintaining a healthy population of mitochondria. Since damaged mitochondria lead to collapse cell homeostasis, mitophagy is believed to protect against diseases related to mitochondrial dysfunction such as neurodegenerative disorders.
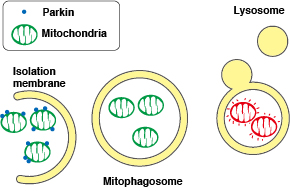
Parkin, an ubiquitin ligase known as the gene responsible for Parkinson’s disease, plays an important role in autophagic elimination of mitophagy. When mitochondria are depolarized and dysfunctional, PTEN-induced putative kinase protein 1 (PINK1) accumulates on the outer membrane, and recruits Parkin on the damaged mitochondria. The outer membrane on the mitochondria is then ubiquitinated through the ubiquitin ligase activity of Parkin. Finally, the poly-
ubiquitinated mitochondria are selectively recognized and executed by autophagic process.
Visualization of Mitophagy with mitochondria-targeted Keima-Red & Parkin
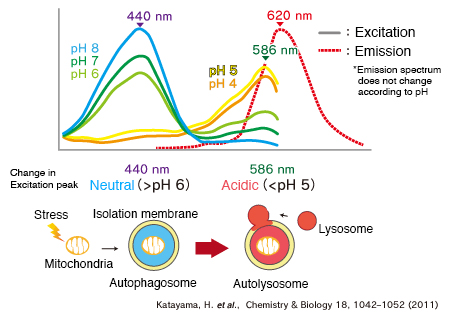
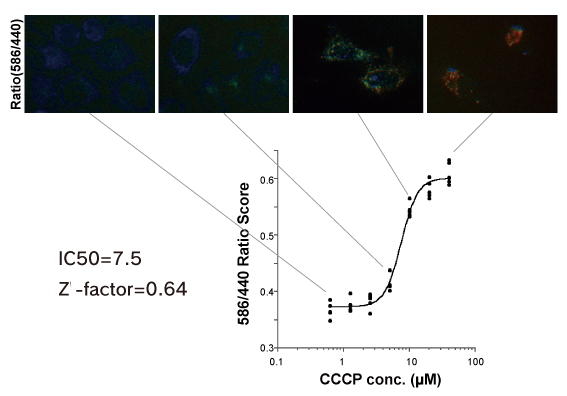
The fluorescent protein Keima has an excitation spectrum that changes according to pH. A short wavelength (440 nm) is predominant for excitation in a neutral environment, whereas a long wavelength (586 nm) is predominant in an acidic environment. When observing a ratio (586 nm/440 nm) image obtained from image data by using these two excitation wavelengths, Keima in a neutral environment has a low ratio value and is displayed in blue. However, in an acidic environment, Keima has a high ratio value and is displayed in red.
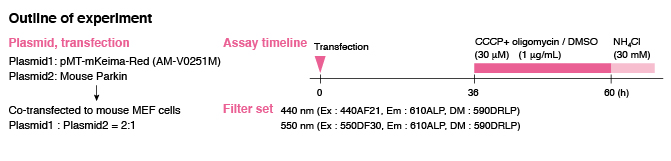
When MT-mKeima-Red, which is the Keima tagged with a mitochondria targeting signal peptide sequence, and Parkin is expressed in target cells, mitophagy is detected and visualized through the difference in fluorescent wavelengths observed before and after drug treatment.
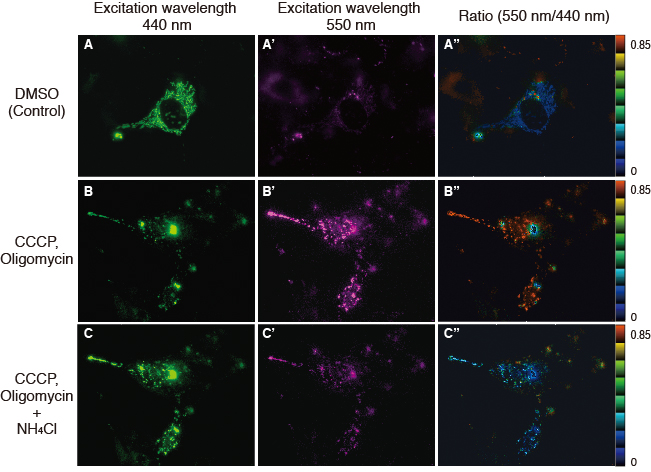
Mitophagy is induced by administration of CCCP and oligomycin, drugs that affect mitochondrial membrane potential, and is observed with 550 nm/440 nm ratio images (A”, B”, C”).
Through mitophagy induction, the mitochondria-localized MT-mKeima-Red is displayed in red in ratio images, showing its localization in an acidic environment (B-B”). The neutralizer NH4Cl is then administered, which forces the entire cell into a neutral environment, and the image returns to blue (C-C”).
This result matches findings in which the progression of mitophagy causes mitochondria to be engulfed in lysosomes when in an acidic environment.
pMitophagy Keima-Red mPark2
What's new?
Bicistronic IRES vector for the co-expression of Keima and Parkin

pMitophagy Keima-Red mPark2 enables the co-expression of MT-mKeima-Red (mitochondria-targeted monomeric Keira-Red) and Parkin (Park2) from the internal ribosome entry site (IRES), as parts of a bicistronic transcript in mammalian cells. This allows the efficient transfection, and the easier imaging and quantitative analysis. The system is also applicable to the HCA (High content analysis) with IN Cell Analyzer.
HCA with IN Cell Analyzer 1000
The stable system that can be used in drug discovery screening.
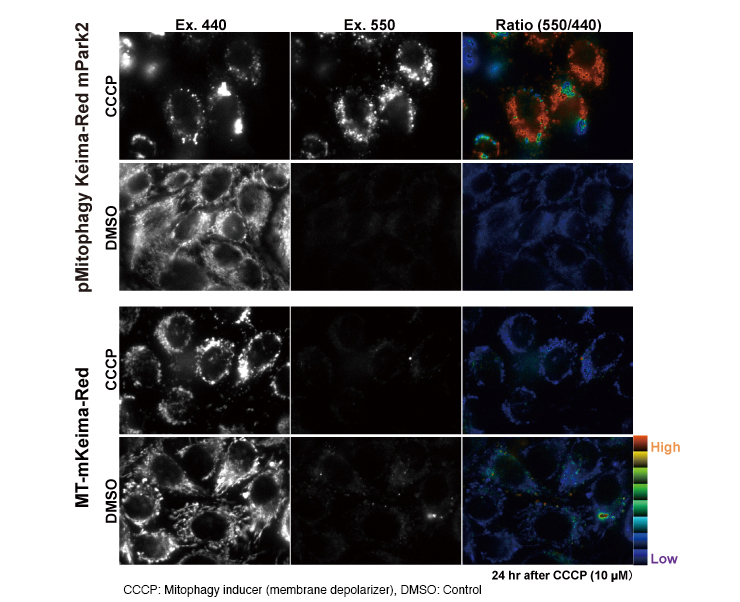
Ratio imaging
Mitophagy is visualized as red in the Ratio (550/440) column. The red color represents high and purple color represents low ratio of Ex.550/Ex. 440.
Publications: Keima-Red has been referenced in these publications
- Katayama H et al. A sensitive and quantitative technique for detecting autophagic events based on lysosomal delivery. Chem Biol. 18, 1042-52 (2011) [PMID: 21867919]
- Choubey V et al. BECN1 is involved in the initiation of mitophagy: It facilitates PARK2 translocation to mitochondria. Autophagy 10, 1105–19 (2014). [PMID: 24879156]
- Safiulina D & Kaasik A. Energetic and Dynamic: How Mitochondria Meet Neuronal Energy Demands. PLoS Biol 11, e1001755 (2013). [PMID: 24391475]
- Togashi K et al. Na+/H+ Exchangers Induce Autophagy in Neurons and Inhibit Polyglutamine-Induced Aggregate Formation. PLoS ONE 8, e81313 (2013). [PMID: 24278418]
- Narendra DP et al. PINK1 rendered temperature sensitive by disease-associated and engineered mutations. Hum Mol Genet. 22, 2572-89. (2013). [PMID: 23459931]
- Bingol B et al. The mitochondrial deubiquitinase USP30 opposes parkin- mediated mitophagy. Nature 510, 370–5 (2014). [PMID: 24896179]
※CoralHue™ fluorescent proteins were co-developed with the Laboratory for Cell Function and Dynamics, the Advanced Technology Development Center, the Brain Science Institute, RIKEN. MBL possesses the license and deals in the products.
Please send us a completed and signed License Acknowledgement.
Please note that the product will be shipped after we receive a
completed and signed License Acknowledgement (PDF file on the right).
Prior to shipping, our staff may contact you to verify the intended use
of the product. Please also note that a separate agreement or a contract
may be required depending on the intended use.
The product you have ordered is sold for research purpose only. It is
not intended for industrial or clinical use, and shall not be used for
any purposes other than research. You are also asked not to hand over or
resell the product to a third party.
If you belong to a profit organization or a business corporation, or
wish to use the product for profit or commercial purposes, please
contact us.

- Fluorescent protein
- Basic fluorescent proteins
- Midoriishi-Cyan [Outline] [Product list]
- Umikinoko-Green [Outline] [Product list]
- Azami-Green [Outline] [Product list]
- Kusabira-Orange [Outline] [Product list]
- dKeima570 [Outline] [Product list]
- Keima-Red [Outline] [Detection of mitophagy with Keima-Red] [Product list]
- Photoconvertible fluorescent proteins
- Dronpa-Green [Outline] [Product list]
- Kaede [Outline] [Product list]
- Kikume Green-Red [Outline] [Product list]
- Organelle targeting vectors [Product list]
- Advanced fluorescent indicators
- Image based Protein-Protein interaction analysis "Fluoppi" [Outline] [Fluoppi Red] [Product list]
- Cell cycle indicator "Fucci" [Outline] [Product list]
- Protein-Protein Interaction Detection System "CoralHue™ Fluo-chase Kit" [Outline] [Product list]
- Anti-CoralHue™ fluorescent protein antibodies
- Anti-CoralHue™ fluorescent protein antibodies [Outline] [Product list]
- Resources
- CoralHue™ vectors full DNA sequence
- Spectrum